BLOGGER TEMPLATES AND TWITTER BACKGROUNDS

Pages

Saturday, February 25, 2012

DIGITAL DIVIDE :

The Digital Divide refers to any inequalities between groups, broadly construed, in terms of access to, use of, or knowledge of information and communication technologies. The divide inside countries (such as the digital divide in the United States) can refer to inequalities between individuals, households, businesses, and geographic areas at different socioeconomic and other demographic levels, while the Global digital divide designates countries as the units of analysis and examines the divide between developing and developed countries on an international scale.


Friday, December 23, 2011

Steps Of Analysis


* Collecting information on how the existing system works

* Establishing its inputs, outputs & processing

* Recording information, for example in the form of data flow diagrams

* Identifying problems

Methods Of Analysis

Examination of documents


* Interviews


* Observation

Systems Analysis Definition

(SAD) The analysis of the role of a proposed system and the identification of the requirements that it should meet. SAD is the starting point for system design. The term is most commonly used in the context of commercial programming, where software developers are often classed as either systems analysts or programmers. The systems analysts are responsible for identifying requirements (i.e. systems analysis) and producing a design. The programmers are then responsible for implementing it.

what is meant by system analyst ?

A system analyst is the person who selects and configures computer systems for an organization or business. His or her job typically begins with determining the intended purpose of the computers. This means the analyst must understand the general objectives of the business, as well as what each individual user's job requires. Once the system analyst has determined the general and specific needs of the business, he can choose appropriate systems that will help accomplish the goals of the business.

Data flow diagram

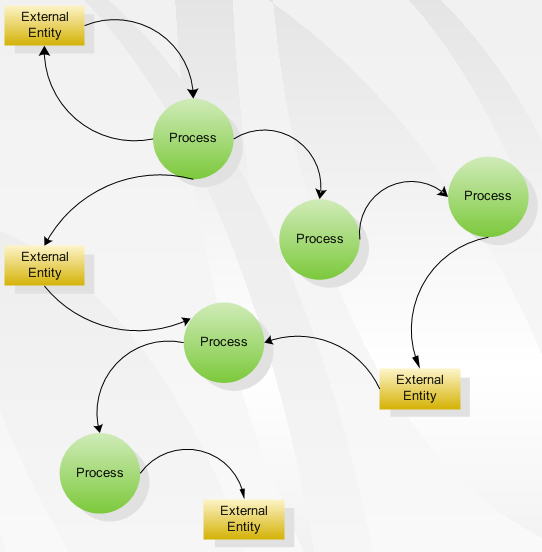
Is a graphical representation of the "flow" of data through an information system, modelling its process aspects. Often they are a preliminary step used to create an overview of the system which can later be elaborated.DFDs can also be used for the visualization of data processing (structured design).


Flowchart

A flowchart is a type of diagram that represents an algorithm or process, showing the steps as boxes of various kinds, and their order by connecting these with arrows. This diagrammatic representation can give a step-by-step solution to a given problem. Process operations are represented in these boxes, and arrows connecting them represent flow of control. Data flows are not typically represented in a flowchart, in contrast with data flow diagrams; rather, they are implied by the sequencing of operations. Flowcharts are used in analyzing, designing, documenting or managing a process or program in various fields.

my playlist