* Collecting information on how the existing system works
* Establishing its inputs, outputs & processing
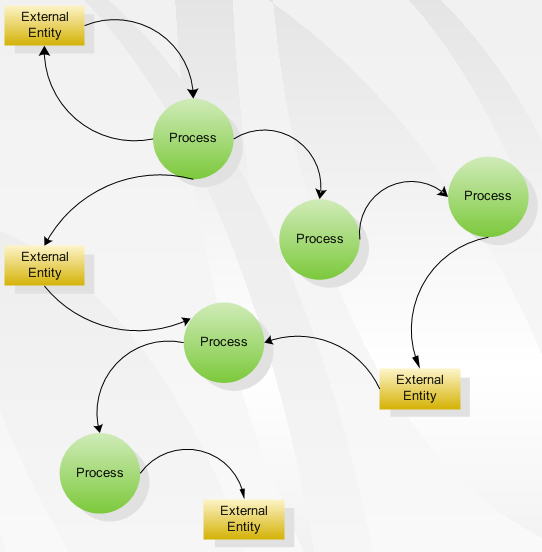
* Recording information, for example in the form of data flow diagrams
* Identifying problems
(SAD) The analysis of the role of a proposed system and the identification of the requirements that it should meet. SAD is the starting point for system design. The term is most commonly used in the context of commercial programming, where software developers are often classed as either systems analysts or programmers. The systems analysts are responsible for identifying requirements (i.e. systems analysis) and producing a design. The programmers are then responsible for implementing it.
A system analyst is the person who selects and configures computer systems for an organization or business. His or her job typically begins with determining the intended purpose of the computers. This means the analyst must understand the general objectives of the business, as well as what each individual user's job requires. Once the system analyst has determined the general and specific needs of the business, he can choose appropriate systems that will help accomplish the goals of the business.

In systems design the design functions and operations are described in detail, including screen layouts, business rules, process diagrams and other documentation. The output of this stage will describe the new system as a collection of modules or subsystems.
The design stage takes as its initial input the requirements identified in the approved requirements document. For each requirement, a set of one or more design elements will be produced as a result of interviews, workshops, and/or prototype efforts.
Design elements describe the desired software features in detail, and generally include functional hierarchy diagrams, screen layout diagrams, tables of business rules, business process diagrams, pseudocode, and a complete entity-relationship diagram with a full data dictionary. These design elements are intended to describe the software in sufficient detail that skilled programmers may develop the software with minimal additional input design.

Advertising Research
Advertising can be a costly endeavor for businesses. To determine the potential effect their advertising might have on a target audience, businesses often conduct research into the content, the media, and the effectiveness of advertisements before they invest heavily in the advertising campaign. Content research measures how the desired content comes across to an audience sample (a limited number of people).

Market Research is a systematic, objective collection and analysis of data about a particular target market, competition, and/or environment. It always incorporates some form of data collection whether it be secondary research (often referred to as desk research) or primary research which is collected direct from a respondent
Environmental monitoring describes the processes and activities that need to take place to characterise and monitor the quality of the environment. Environmental monitoring is used in the preparation of environmental impact assessments, as well as in many circumstances in which human activities carry a risk of harmful effects on the natural environment. All monitoring strategies and programmes have reasons and justifications which are often designed to establish the current status of an environment or to establish trends in environmental parameters. In all cases the results of monitoring will be reviewed, analysed statistically and published. The design of a monitoring programme must therefore have regard to the final use of the data before monitoring starts.


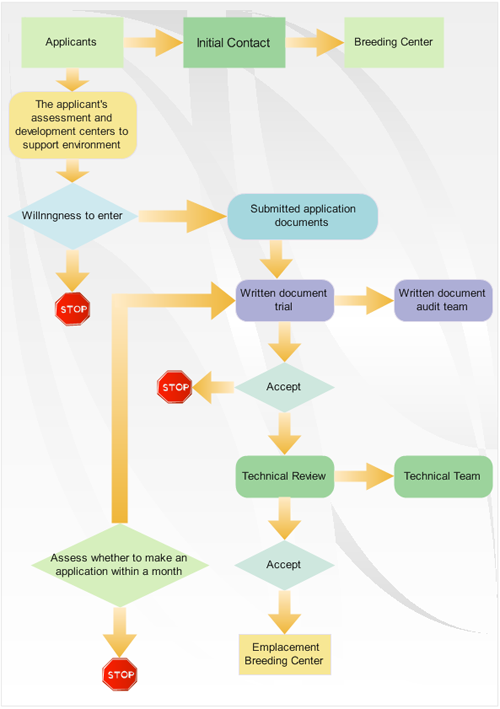
A simple flowchart representing a process for dealing with a non-functioning lamp.A flowchart is a type of diagram that represents an algorithm or process, showing the steps as boxes of various kinds, and their order by connecting these with arrows. This diagrammatic representation can give a step-by-step solution to a given problem. Process operations are represented in these boxes, and arrows connecting them represent flow of control. Data flows are not typically represented in a flowchart, in contrast with data flow diagrams; rather, they are implied by the sequencing of operations. Flowcharts are used in analyzing, designing, documenting or managing a process or program in various fields.

Modern PFD of a plant for gas sweetening by amine absorption
Historical PFD from 1931 showing the Andrussow processA process flow diagram (PFD) is a diagram commonly used in engineering to indicate the general flow of plant processes and equipment. The PFD displays the relationship between major equipment of a plant facility and does not show minor details such as piping details and designations. Another commonly-used term for a PFD is a flowsheet.


